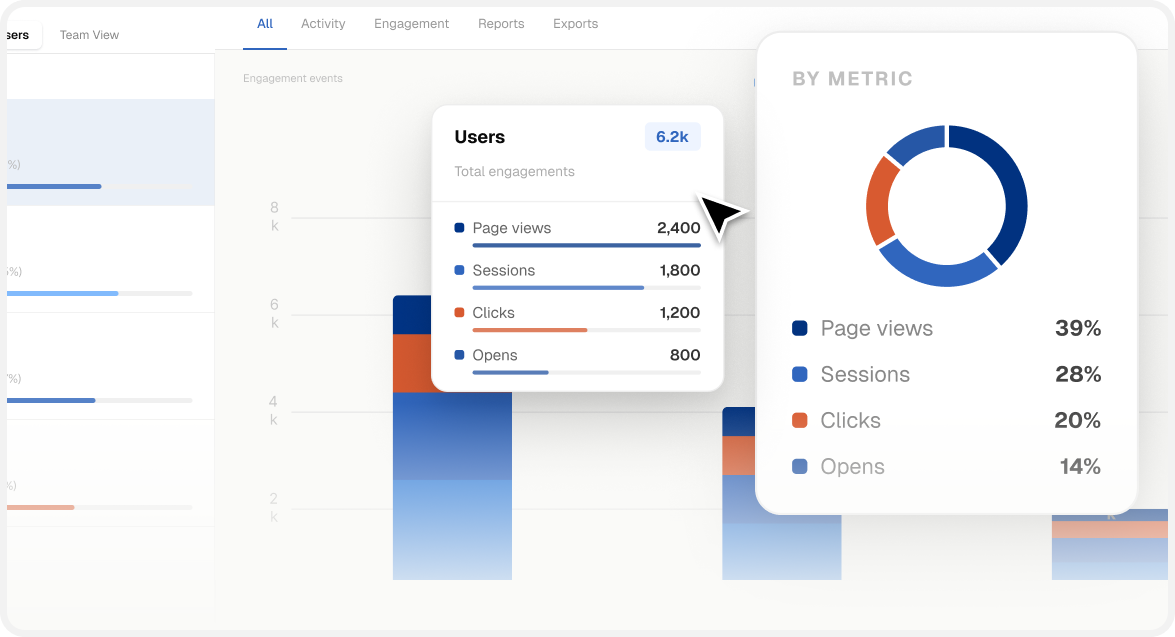
Measuring adoption · Enterprise analytics · Internal platforms

Measuring adoption

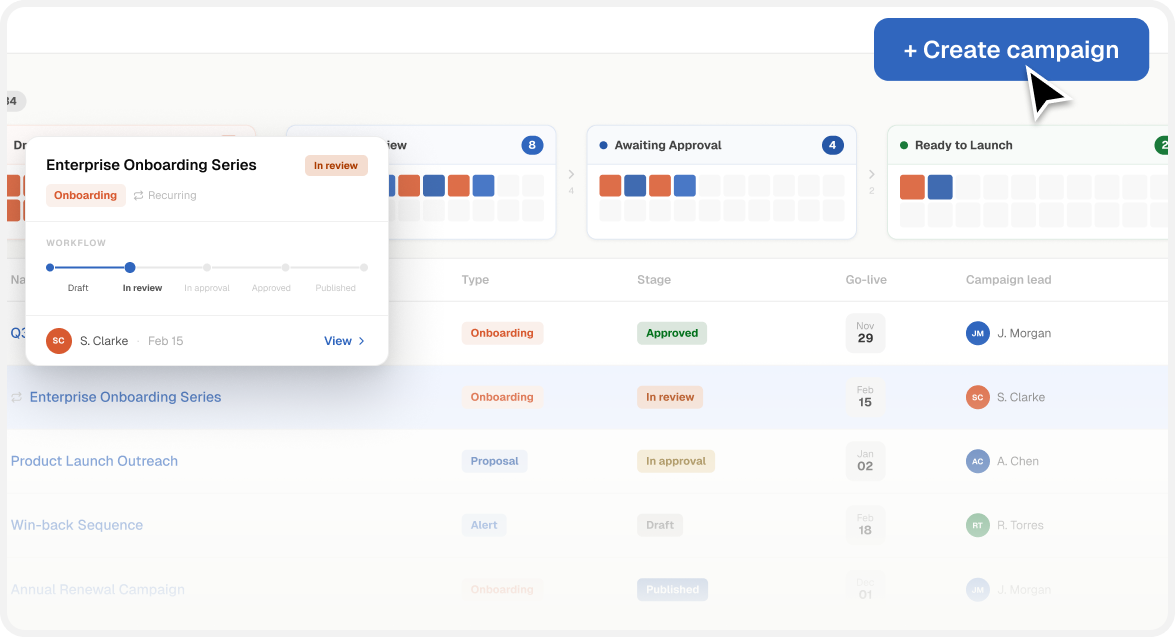
A performance dashboard for leadership at a large enterprise, measuring adoption of a new internal platform.

Performance dashboard
Team
4 designers
Timeline
3 months
Worked with
Engineering, analysts
Status
In build

The short version

  1. The brief

    Measure adoption of a platform that hadn't launched yet. There was no usage data.

  2. The catch

    The requirements asked for “adoption” but never said what it meant.

  3. The call

    I defined it as distinct people using the platform, not total activity.

  4. The cut

    Every candidate metric, two tests each: is it actually recorded, and would anyone act on it? Two cut, one reworked.

  5. The feedback

    My design lead pointed out that my metric table named who reads each number, not who it measures. I rebuilt it around the two groups: the people who contribute to the platform, and the people who use it.

  6. The test

    Testers missed the second audience hidden behind a switcher, so I split it into two tabs.

  7. Where it is now

    In build. The metrics are in the spec; the numbers come after launch.

My role & impact

Senior Product Designer. Four designers, including the design lead.

  • Owned the performance dashboard from requirements to build
  • Defined adoption for the program, and what each surface could count
  • Designed one dashboard for two populations: the people who use the platform and the teams who produce for it

My responsibilities

  • Measurement scoping
  • Metric definition
  • Information architecture
  • Data visualization
  • Prototyping in Claude Code
Table of Contents
  1. PROBLEM: What was I asked to measure?
  2. FRAMING: What does adoption mean?
  3. ANALYSIS: Which numbers couldn't be trusted?
  4. SOLUTION: What does the dashboard show?
  5. DESIGN DECISION: Who reads the dashboard?
  6. ITERATION: What did I get wrong?
  7. REFLECTION: How would I know it worked?

PROBLEM: What was I asked to measure?

Adoption, before launch, so there was no usage data to work from.

The client wanted evidence that a new internal platform was getting used before it invested further. Nothing had launched, so there was no usage data and no baseline. I owned the dashboard that would report adoption.

Adoption wasn't defined. The requirements listed candidate metrics and named adoption without saying what it meant. So the first job was to decide what to count.
FRAMING: What does adoption mean?

I defined adoption as distinct users. Two of six metrics had no recordable action.

I went through every candidate metric against two tests: does the tool record the action, and does someone act on the number. Two failed both. I could describe what each would measure, and I couldn't confirm the tool would record it. Engineering reached the same two from their side.

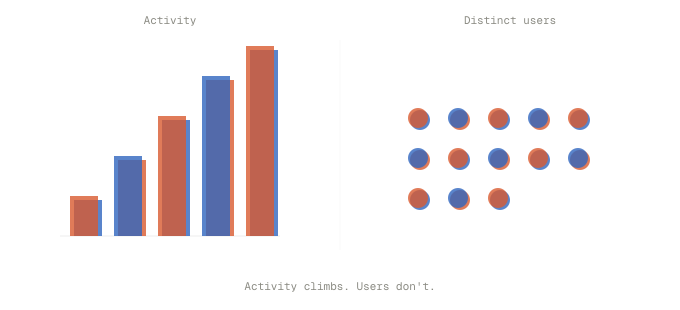
The definition I landed on separated people from activity. A raw count of usage can climb with a few heavy users. Distinct users doing something is adoption. That distinction wasn't in the requirements, and it held through every later version.

ANALYSIS: Which numbers couldn't be trusted?

Six metrics, two tests each. I reworked one with engineering and cut two.

The requirements listed six candidate metrics. I tested each against two questions: does the platform record the action, and would someone act on the number. One inflated the count by treating a single visit as multiple readings. Another collected a rating that couldn't point at any one item. A third couldn't be counted reliably. I reworked one with engineering and cut the other two.

For the inflated count, I proposed a different trigger to engineering. They confirmed the platform could record it. The number would track a deliberate action and point at one item. The rating and the unreliable count had no fix within the build window, so I cut both.

SOLUTION: What does the dashboard show?

The dashboard answers in a deliberate order: who first, then what, then where.

The dashboard answers in a deliberate order: who is showing up, then what they are doing, then where. The numbers lead with people, not activity. A raw count of actions can climb without adding users. Showing distinct people first keeps adoption honest.

The alternative was to lead with a rate. With a small population, a percentage hides the count behind it. A lead cannot tell from a rate alone how many people it stands on. Keeping the raw count means the population stays visible.

DESIGN DECISION: Who reads the dashboard?

I tested an early layout and two of three people missed the second audience.

The dashboard carries two audiences. I tested an early layout with three people. Two could not tell the second audience was behind the control. I split the view so each audience gets its own screen.

The control switched the whole view from one audience to the other. It looked static, and two testers treated it as a label. Splitting the audiences meant hiding one behind the other. The testers confirmed that people check one audience at a time, so the tradeoff held.

ITERATION: What did I get wrong?

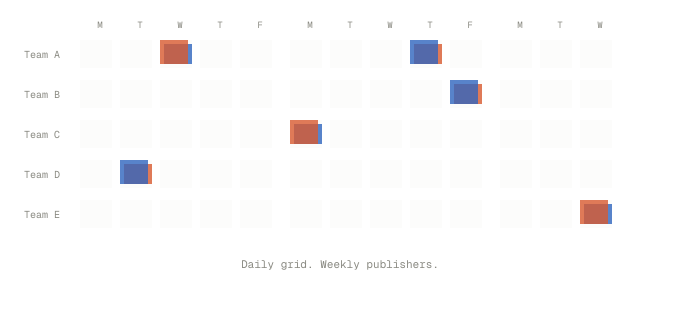
A contribution frequency heatmap on a daily grid, when teams do not contribute daily.

I built a contribution frequency view early, before adoption became the priority. I chose a daily grid without checking how often teams contribute. Most of the cells were empty. The mismatch only showed once I presented it, and I took it off the dashboard.

REFLECTION: How would I know it worked?

Distinct users, whether they come back, what a low number would mean, and whether a lead opens it alone.

I reworked one metric with engineering and cut two others before the spec was written. The platform is in build. What follows is what I would watch at launch.

Whether people come back.

A launch spike that falls back means people tried the platform once. I would watch distinct users in the first week against the same count a month later.

Where the data goes after the dashboard.

A lead who exports the numbers into a spreadsheet wants a cut the dashboard doesn't give. Knowing which cut would tell me what to build next.

Detailed case study available on request.